Why Charting Libraries Struggle with Generative AI
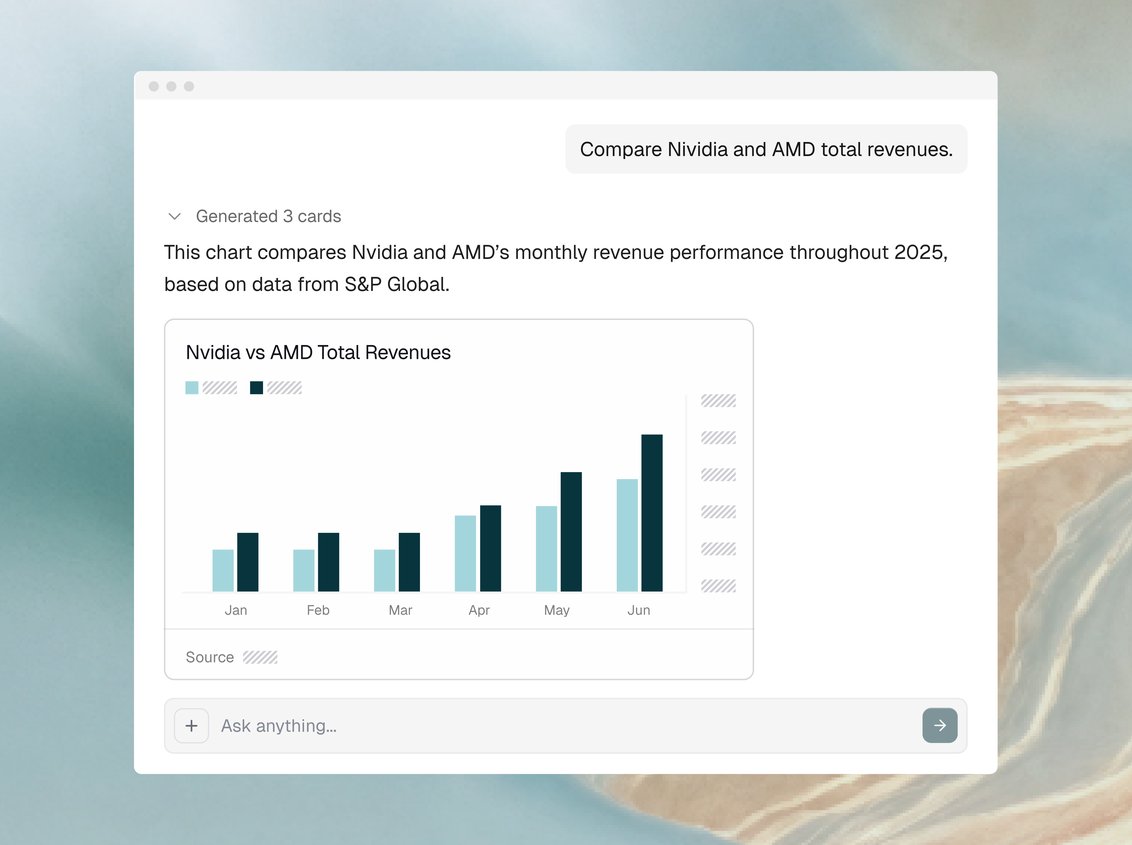
Charting libraries are excellent for static dashboarding. Highcharts, ChartIQ, Plotly, and similar tools do one job extremely well: given perfectly transformed, schema-ready data and a predefined chart specification, they render high-quality, interactive visualizations. But this workflow assumes:
- You know the chart type in advance
- You know which fields matter
- The dataset schema is stable
- The view will not change frequently
- Engineers can define and maintain every visualization by hand
For a traditional business intelligence dashboard, this model works great. For generative AI, it's unworkable.
Ad-Hoc Questions Break the Charting Model
The strength of generative AI is that users can issue arbitrary, ad-hoc analytical questions:
- "Break this dataset down by industry and rank by growth."
- "Compare this metric to the previous two cycles."
- "Highlight anomalies over the past decade."
The question space becomes effectively unbounded. But charting libraries only support what you've explicitly preconfigured. The friction becomes obvious:
AI expands the universe of possible questions. Charting libraries constrain the universe of possible answers.
Even worse, the burden of bridging that gap shifts entirely onto the engineering team. Every new question becomes a new schema, new transformation, new chart configuration, new maintenance surface.
Why LLMs Alone Can't Solve This
In theory, you could ask an LLM to produce chart specifications dynamically. In practice, this fails for structural reasons:
- Schema interpretation is unreliable
LLMs misidentify fields, misclassify data types, and conflate semantically similar columns. - Transformations are inconsistent
Aggregations, groupings, filters, joins, normalizations, and window functions are produced inconsistently and often incorrectly. - Math and unit reasoning is fragile
LLMs routinely mishandle units, scaling, and multi-axis relationships, especially when multiple measures differ by orders of magnitude. - Structured output cannot be guaranteed
Even with function calling, JSON schemas, and constrained decoding, LLMs produce invalid or incomplete chart specs under distribution shift. - Metrics and fields can be hallucinated
LLMs often invent dimensions, measures, or categories that do not exist in the dataset. - Non-determinism breaks trust
The same question can produce different transformations across runs which is unacceptable for analytical or compliance-driven workflows.
LLMs interpret natural language well, but they do not perform reliable, deterministic, schema-aware data reasoning. This is exactly the capability a charting library depends on.
What's Missing: A Deterministic Reasoning Layer
To support ad-hoc analytical questions, you need a layer that can:
- Parse dataset schema and metadata deterministically
- Select relevant fields for the question
- Validate that fields exist
- Generate correct, reproducible transformations
- Select an appropriate visualization type based on data shape
- Apply consistent scales, units, and color encodings
- Produce a fully structured chart specification
- Ground everything in transparent sourcing and methodology
This is the layer that neither LLMs nor charting libraries provide. It is also the layer that determines whether an AI-generated analysis is correct, reproducible, and trustworthy.
Technical Comparison
Tako: A Reasoning Engine for Structured Data
Tako provides this missing reasoning layer. It is not a charting library; it uses charting libraries internally. Tako is the deterministic engine that converts ad-hoc natural language questions + raw structured data into validated transformations + a correct, theme-consistent visualization + transparent sourcing. At a high level, Tako performs the following:
- Schema and Type Inference
Automatically classifies fields as categorical, sequential, ordinal, temporal, divergent, or identifier. - Semantic Field Selection
Determines which fields answer the question and validates their existence. - Transformation Generation
Produces verified aggregations, filters, joins, comparisons, window functions, and normalizations. - Visualization Selection and Encoding
Chooses chart types based on data geometry and question intent. Applies scales, axis alignment, and color encoding consistent with your product theme. - Consistency and Determinism
Outputs reproducible specs that do not drift across runs or model versions. - Data Lineage and Explainability
Produces a sourcing and citation drawer describing fields, transformations, and methodology used. - Narrative Insight Generation
Generates text that summarizes trends, outliers, and patterns grounded in the validated transformations.
The end result is a complete analytical knowledge card produced on demand — visual, textual, structured, and explainable — without engineering intervention.
Conclusion
Charting libraries are exceptional tools for rendering predefined views from well-structured data. LLMs are exceptional tools for interpreting natural language questions. But neither solves the core problem introduced by generative AI:
users ask ad-hoc analytical questions, and the system must generate a correct, structured, deterministic answer on the fly.
This requires a reasoning layer that understands datasets, validates operations, produces consistent transformations, and generates explainable visual + textual outputs. That is what Tako was built to provide.
About the author
Alex Rosenberg
Alex is the CEO and founder of Tako, an AI data analyst that converts natural-language questions into visual analytics and insights. His previous company, Graphiq, was acquired by Amazon to power Alexa's open-domain Q&A, and he later led the Alexa Multi-Agent team at Amazon. He has over a decade of experience building and scaling knowledge graphs and data systems for AI applications.
Ground your AI agents in real-time, structured data — web and premium sources unified in one API. Try Tako in the Playground or .